Air start conditions

Altitude
m
Unit system (reset)


°C
% RH

Air flow
m³/h

Sensible Heat Factor

Factor

Coil Performance
Value
%
kW

Moisture recovery
Value
%
kW

Coil Performance
Value
%
kW

Moisture recovery
Value
%
kW

Coil Performance
Value
%
kW

Moisture recovery
Value
%
kW

Coil Performance
Value
%
kW

Moisture recovery
Value
%
kW


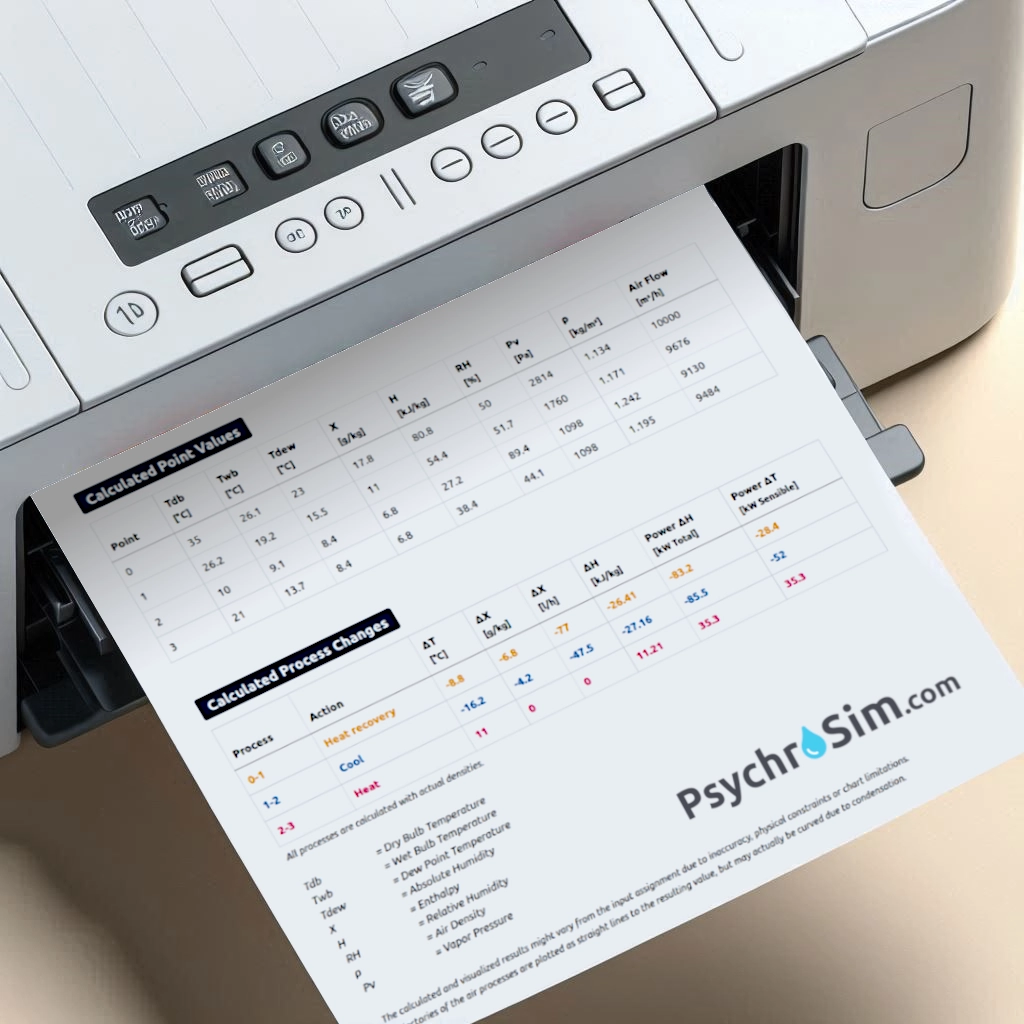
Point Values


Process Changes

All processes are calculated with: and .

Tdb
= Dry Bulb Temperature
X
= Absolute Humidity
H
= Enthalpy
RH
= Relative Humidity
ρ
= Air Density
Pv
= Vapor Pressure
Tdew
= Dew point Temperature
Twb
= Wet bulb Temperature


About this tool

Online Psychrometric Chart

This tool is an Online Interactive Psychrometric Chart.
With a Psychrometric Chart, you can draw processes of humid (moist) air and calculate air conditions.
This chart is widely used in mechanical engineering like HVAC technology and plots the Temperature versus the Absolute Humidity. In the diagram, Relative Humidity and Enthalpy lines are added as well to determine the exact air conditions.
The Psychrometric Chart is also known as the "Mollier-Diagram" when the axes are flipped, especially in European countries.

Calculator and Sketcher

With this online psychrometric tool, you can calculate and visualize thermodynamic processes that affect moist air.
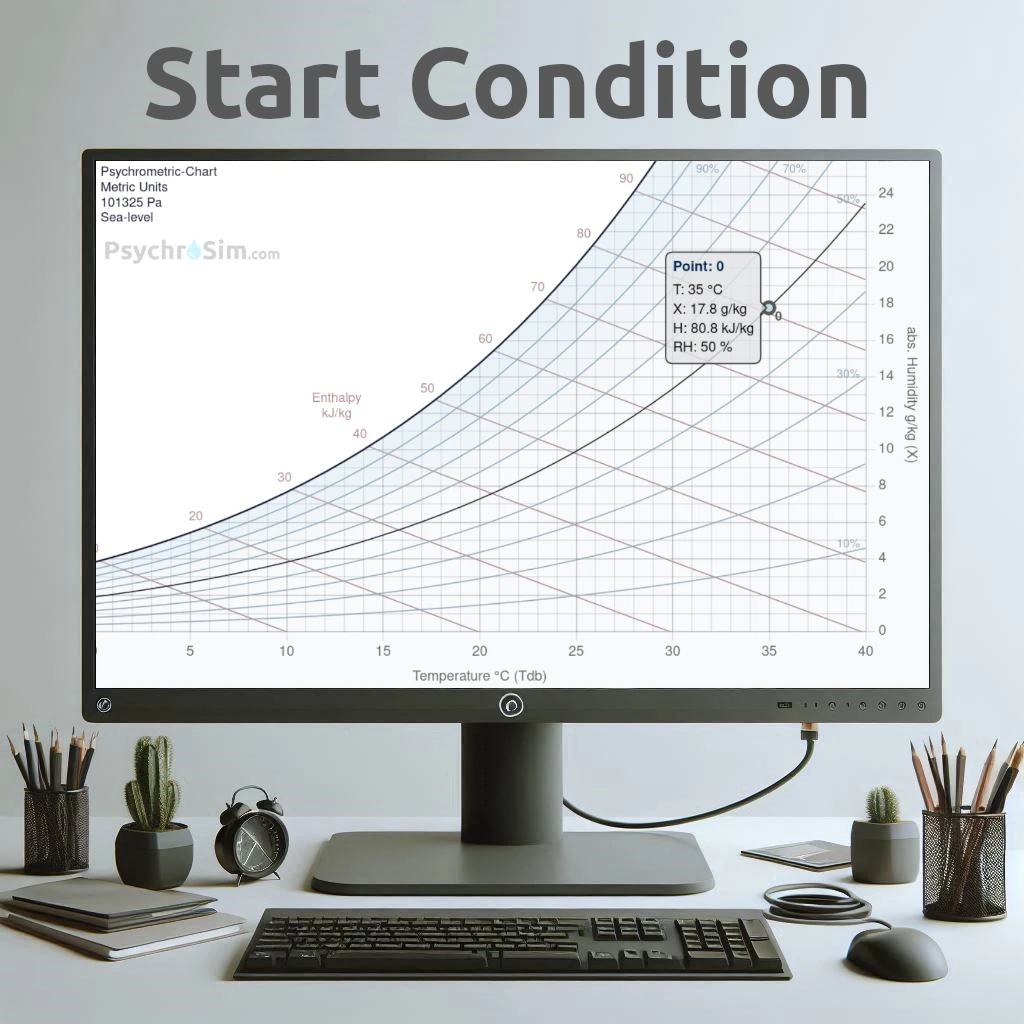
Step 1: Set the Air start conditions
step 2: Apply one or more actions, like Heat, Cool, Mix, Heat Recovery and Humidify.
The air conditions are then calculated, and the new point is plotted automatically into the chart.

Customizations

  • Chart Style: Psychrometric-Chart or Mollier-Diagram. The x/y-axes will flip
  • Units-system can be set to Metric(SI) or Imperial(I-P). This affects the units of the chart axes, input parameters and calculated results.
  • Altitude: The altitude is set to 0 m height (sea level), but can be changes manually. The formulas in the calculations depend on the altitude (air pressure). Therefore, another altitude will result in another psychrometric chart.
  • Axes: You can adjust the axes min/max values, so you can focus on a part of the diagram.
  • Comfort area: This visual feature can be switched on/off and can be adjusted according to your desired Temperature and Humidity ranges.

PDF export

If you want to save your Chart and results in a PDF-report, please push the button "Save PDF" under the chart, and the download immediately starts.

Synonyms and other languages

  • ΕΝ: Psychrometric Chart / Mollier Diagram / Carrier Diagram
  • FR: Diagramme psychrométrique / Diagramme de Mollier / Diagramme de Carrier
  • ES: Diagrama psicrométrico / Diagrama de Mollier / Diagrama de ASHRAE / Diagrama de Carrier
  • IT: Diagramma psicrometrico / Diagramma di Mollier / Diagramma di Grosvenor / Diagramma di Carrier
  • DE: Mollier-Diagramm / Carrier-Diagramm / h-x-Diagramm
  • NL: Mollierdiagram / h/x-diagram
  • RU: Психрометрическая диаграмма Молье
  • GR: Ψυχρομετρικό διάγραμμα / Διάγραμμα Mollier


Psychrometric Chart theory explained

Dry Bulb Temperature - Tdb
The temperature axis in the diagram is also know as the dry bulb temperature (Tdb). This parameter is popularly known as temperature when people read the thermometer.
The dry bulb temperature is called 'dry bulb' because the measured temperature is not affected by any moisture in the air.

Units:
  • Degrees Celsius(°C). Zero Kelvin equals to -273°C.
  • Degrees Fahrenheit(°F) - Imperial units
Dry Bulb Temperature

Wet Bulb Temperature
The Wet Bulb Temperature (Twb) represents the air temperature when fully adiabatic saturated (100% Relative Humidity). To make it more understandable: it is the temperature of a wet object in an air flow.
When the air flow is not saturated, moisture of the wet object will evaporate (adiabatic process) in the air which results in a lower temperature of that object; the wet bulb temperature of the air.
When the air flow is saturated (100% RH), the temperature of the air flow is equal to the wet bulb temperature of the air.
The Enthapy of a random given air condition is the same as its Wet Bulb Temperature.

Units:
  • Degrees Celsius(°C) at 100% Relative Humidity
  • Degrees Fahrenheit(°F) at 100% Relative Humidity - Imperial units
Wet Bulb Temperature

Dew Point Temperature
The Dew Point Temperature (Tdew) is the temperature where water vapor starts to condensate from the air. At lower temperatures the air can not hold the amount of water.
Like the Wet Bulb Temperature the Dew point Temperature is also fully saturated (100% Relative Humidity).
The absolute humidity of a random given air condition is the same as its Dew Point Temperature.

Units:
  • Degrees Celsius(°C) at 100% Relative Humidity
  • Degrees Fahrenheit(°F) at 100% Relative Humidity - Imperial units
Dew Point Temperature

Absolute Humidity
Absolute Humidity (X) is the actual amount of water vapour that is absorbed by the air, regardless of the temperature of the air. Because it is not affected by the temperature, the volume of the air is also inrelevant. Therefore this parameter is given as a weight ratio:
  • grams per kilogram (g/kg)
  • millipounds per pound (mlb/lb) - Imperial units
Absolute humidity

Relative Humidity
The Relative Humidity (RH) is the the ratio in a percentage (%) of the amount of Absolute Humidity compared to the amount of moisture that would be present if the air were saturated at the smae temperature.
Relative Humidity is often abbreviated to ' RH'.
  • 100% RH means that the air is saturated.
  • 0% RH means that no moisture is present in the air.
  • 30% RH means that 30% of the possible moisture weight is absorbed.
Relative Humidity

Enthalpy
Enthalpy (H) is know as the total amount of energy the air mixture. This energy can be expressed in sensible energy (absorbed temperature) and latent energy (absorbed moisture).
This means that an air mixture with a lot of moisture can have the same Enthalpy as air with less moisture absorbed but with an higher temperature.
Units:
  • kiloJoules per kilogram (kJ/kg)
  • British thermal unit per pound (BTU/lb) - Imperial units

Important to know when converting Enthalpy from metric to imperial units is that 0 kJ/kg is related to 0°C and 0 BTU/lb is related to 0°F (other zero point)
Enthalpy