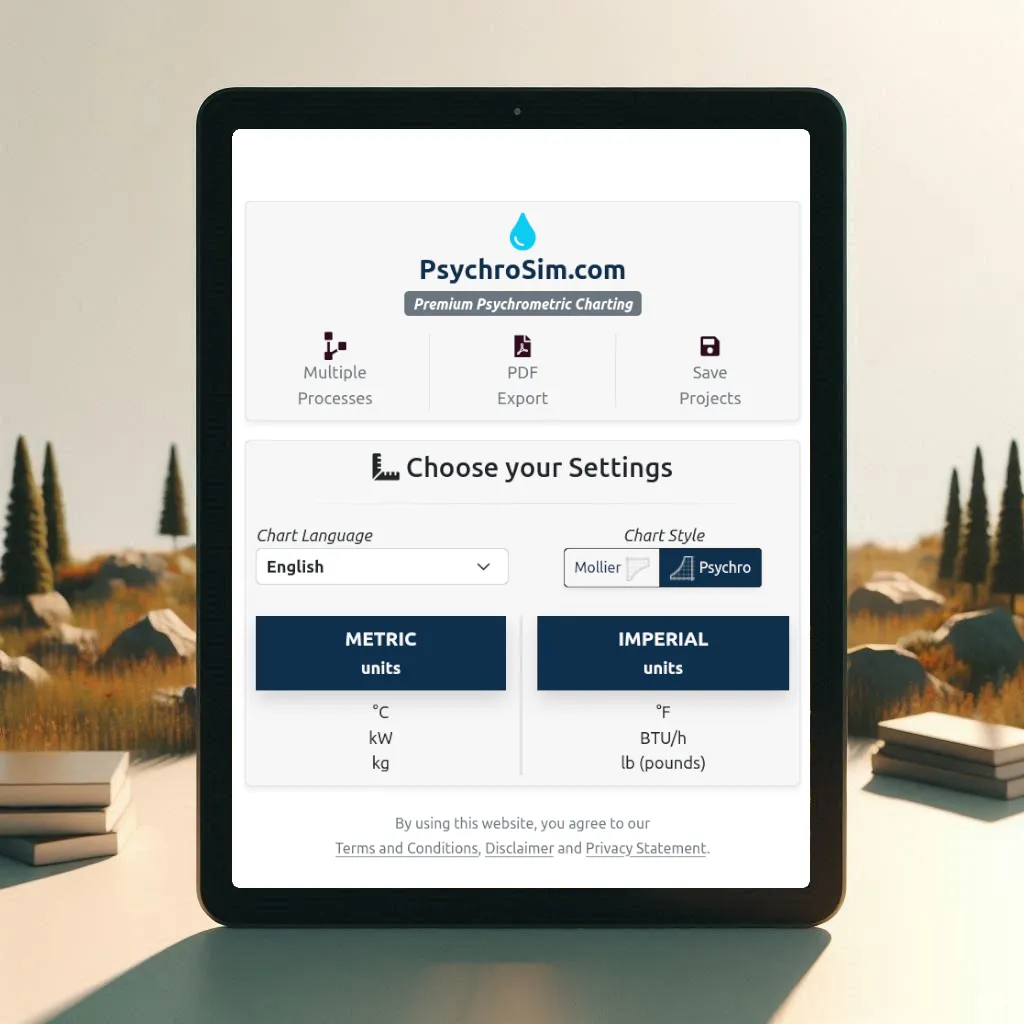
DÉMARRER    Diagramme psychrométrique


Plusieurs processus

Avec cet outil en ligne, vous pouvez simuler et visualiser des processus thermodynamiques qui affectent l'air humide.

Psychrometric Chart animation

Simulez 5 processus consécutifs

Après avoir entré l'État initial de l'air, telles que l’altitude et le Débit d'air, vous pouvez effectuer diverses actions, telles que:

 Refroidissement

 Chauffage

 Mélanger

 Humidification

 Récupération


Le nouvel état de l'air est calculé et ce nouveau point et le processus seront automatiquement dessinés dans le diagramme.

Chart Settings

Upon accessing the tool, you will have the opportunity to set your general settings. Choose your preferred chart style and language, and select the unit system that you are familiar with.
  • Chart Style: Mollier/ Psychrometric-Chart. The x/y-axes will be flipped.
  • Chart Language: Input and output fields will be translated to your selected language.
  • Units-system: Metric(SI) or Imperial(I-P). This affects the chart, input and calculated values.

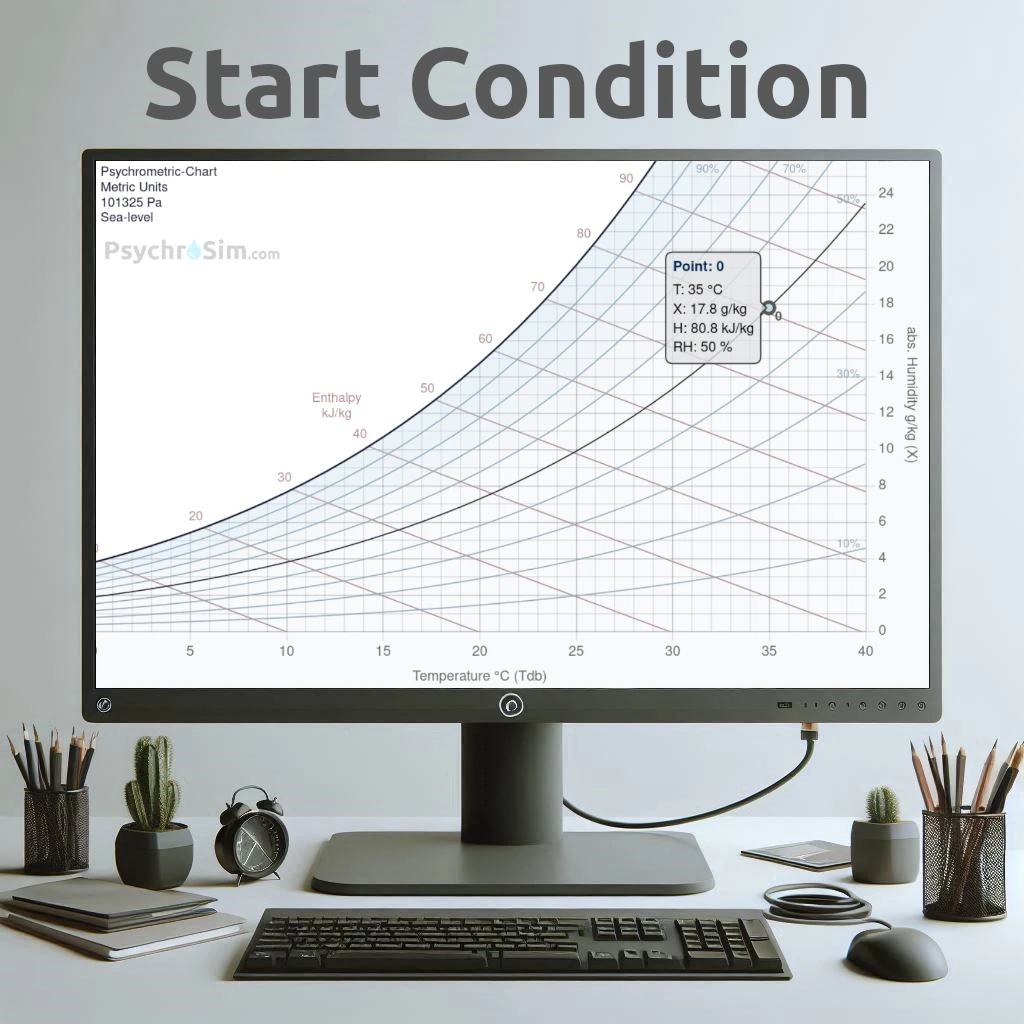
In the chart settings (icon under the chart), you can adjust the Temperature Axis and Humidity Ratio Axis, enable and set your Comfort Area and define the Air Density.

  • Axes: By adjusting the ranges, you can focus on just a part of the diagram.
  • Comfort Area: This is the range of the desired Temperature and Humidity. On/Off or customizable.
  • Density is standard set to actual Density (dynamic value). If enabled, the calculator will use the uniform density you set (fixed value).
Psychrometric Chart Settings
Find Air Condition

Trouver les conditions de l'air

Il est possible de trouver la condition de l'air en fonction de l'intersection entre deux de ces types de paramètres:
  • Température de bulbe Sèche
  • Température du bulbe humide
  • Température du point de rosée
  • Ratio d'humidité
  • Humidité relative
  • Enthalpie
Et aussi de calculer:
  • Densité de l'air
  • Pression de vapeur

Calculated results

Results are plotted in the chart, but also as numbers in tables. Two tables are under the chart:

  • Calculated Point Values: All psychrometric properties of the plotted air conditions.
  • Calculated Process Changes: All psychrometric process changes between the points.

Users with the "Complete Plan", can save up to 15 Projects and the chart, input fields and the results can be downloaded as an PDF-export as well.

Download Example PDF Export
Save and Export Results


 START   Psychrometric Chart

Pricing